
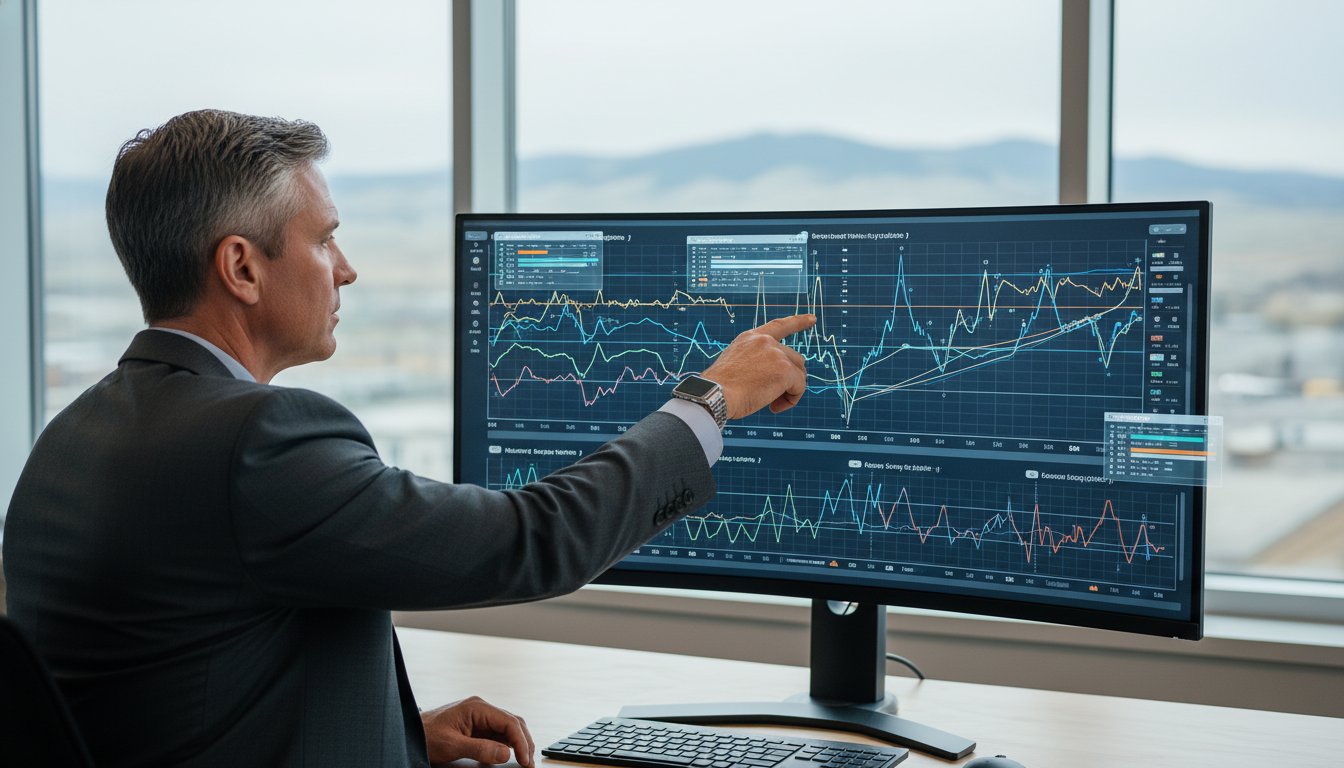
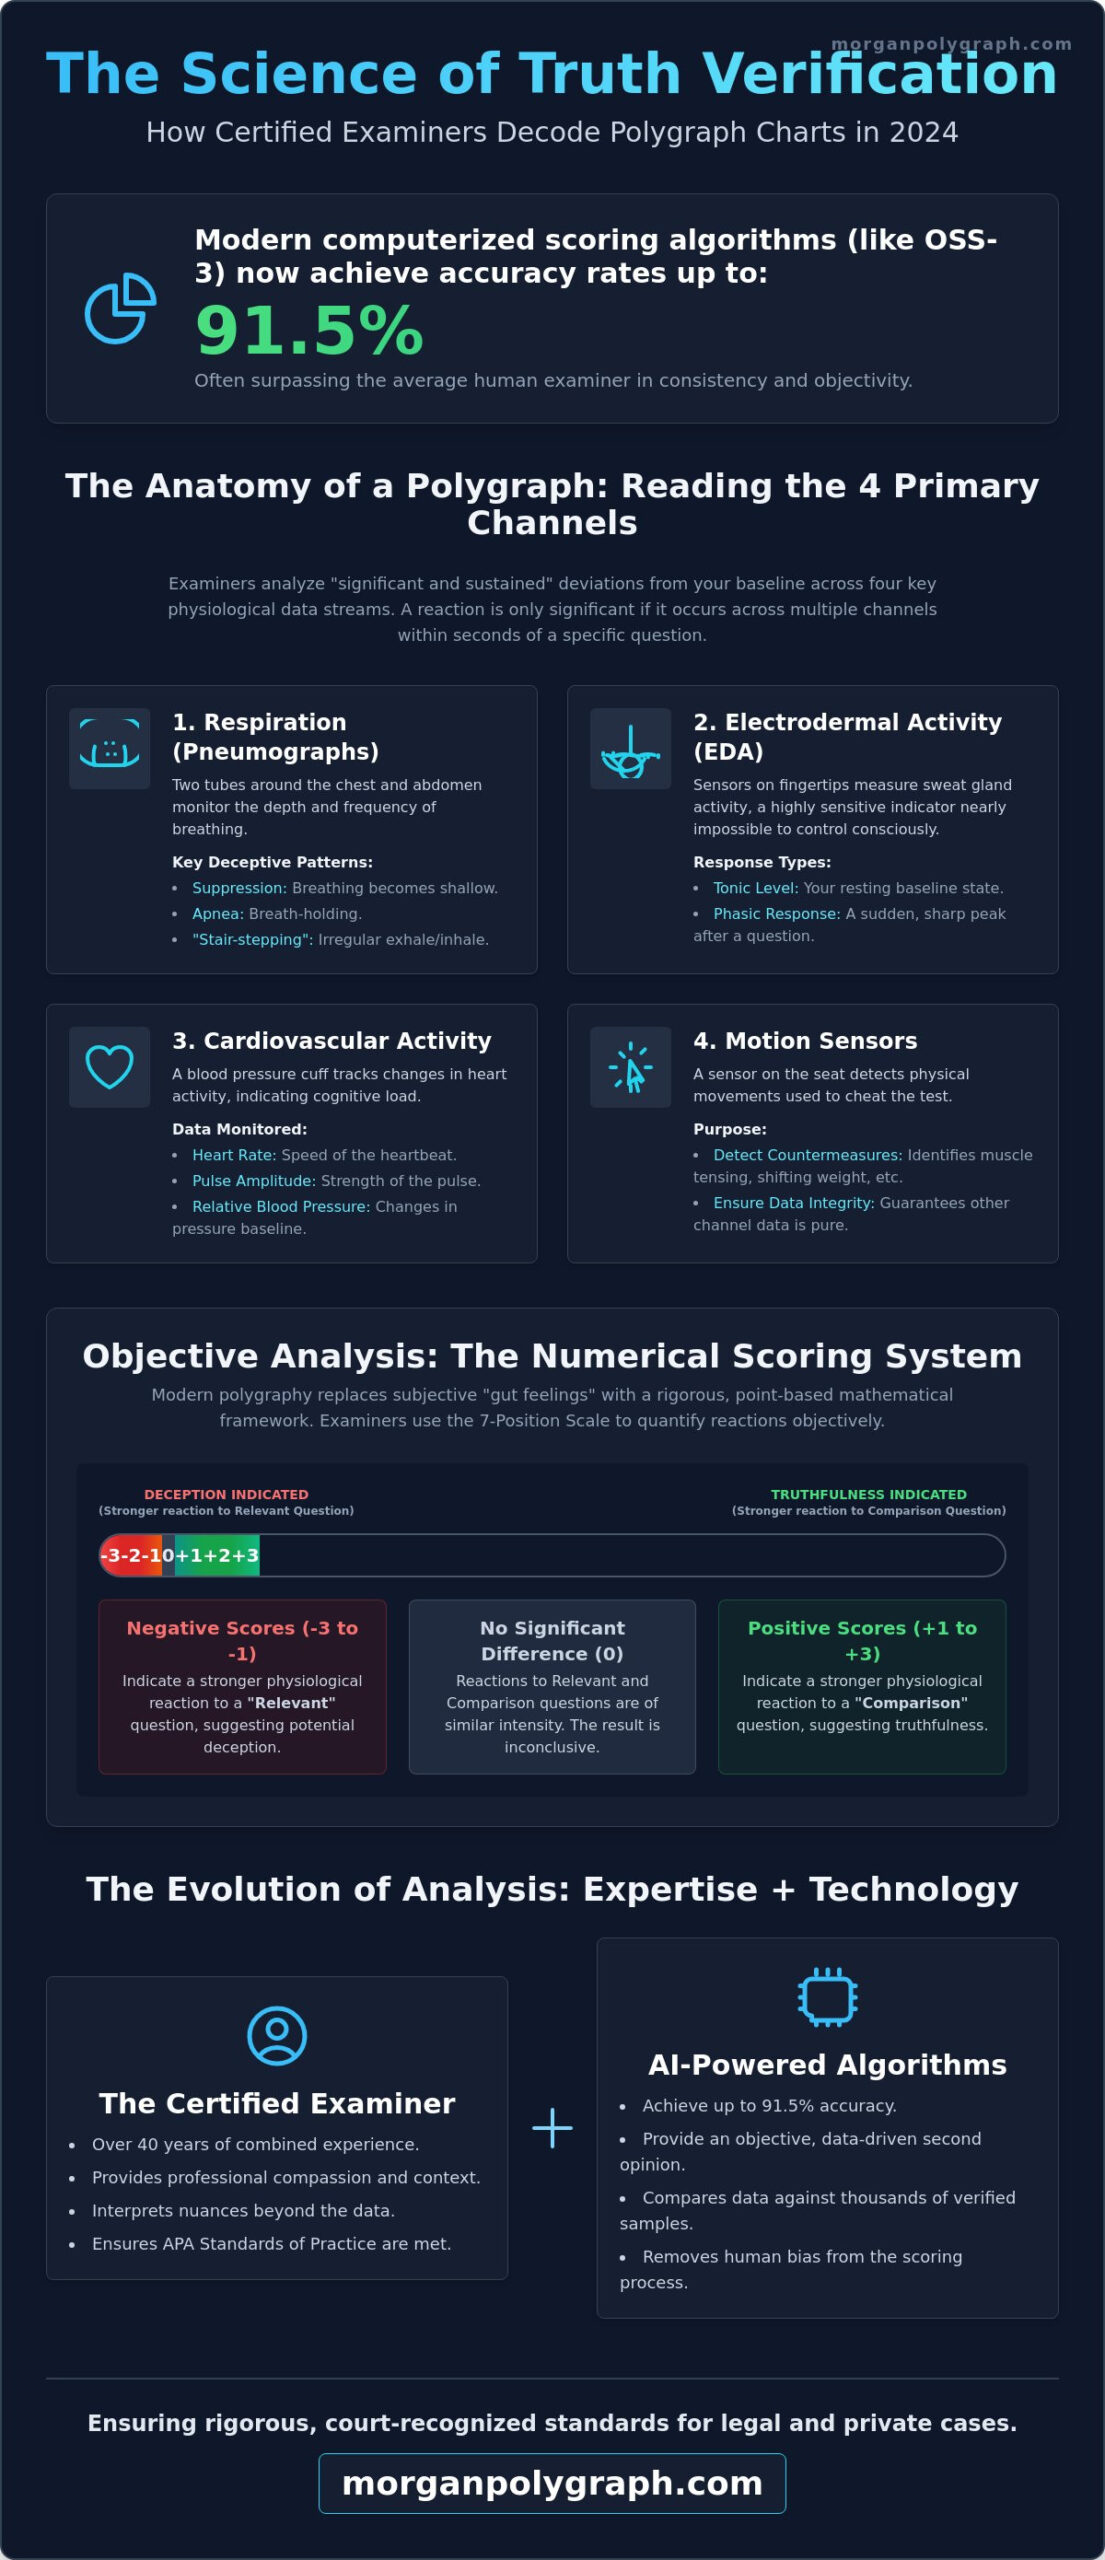
Did you know that modern computerized scoring algorithms like OSS-3 now achieve accuracy rates up to 91.5%, often surpassing the average human examiner in consistency? Many people facing a lie detector test worry that their natural nerves or a racing heart will trigger a false positive. It is a valid concern, but the science of how are polygraph charts read has evolved far beyond simple hunches or subjective guesses. At Morgan Polygraph, we combine over 40 years of combined experience with cutting-edge AI-powered tools to ensure that every physiological signal is interpreted with clinical precision and professional compassion.
You deserve to understand the rigorous standards that govern your results and protect your reputation. In this guide, you will learn exactly how certified examiners decode complex data into clear truth verification using the 2024 APA Standards of Practice. We will break down the four primary data channels, explain how numerical scores are calculated fairly, and show you why modern technology makes the process more reliable than ever. This overview provides a clear look at the methodical process used to transform squiggly lines into objective, court-recognized insights.
Key Takeaways
- Discover the four primary physiological channels monitored during a session and understand how are polygraph charts read by identifying sustained deviations from your baseline.
- Learn how examiners use standardized numerical scoring systems to quantify data objectively rather than relying on subjective gut feelings.
- Understand why a physiological reaction is only significant if it occurs across multiple data channels within seconds of a specific question.
- Explore how cutting-edge AI algorithms provide an objective second opinion by comparing your data against thousands of verified truthful and deceptive data sets.
- See why professional certification and experience are vital for ensuring that results meet the rigorous standards required for legal and private cases in Idaho.
The Anatomy of a Polygraph Chart: Reading the Four Primary Channels
A polygraph chart serves as a precise visual record of your Autonomic Nervous System (ANS). When a person undergoes a test, the examiner isn’t looking for a single spike. Instead, they analyze “significant and sustained” deviations from an established baseline. Understanding how are polygraph charts read requires looking past the digital display to the biological markers that have defined this science for decades. Under the August 23, 2024, APA Standards of Practice, these recordings must meet strict quality thresholds to be considered valid for evidentiary or investigative use. For a broader perspective on the history of these tools, you can review this Polygraph overview. Every line on the screen represents a specific involuntary response triggered by the brain’s fight-or-flight mechanism.
Respiration Channels: The Pneumographs
Examiners use two specialized tubes, known as pneumographs, to monitor breathing. One is placed around the chest and the other around the abdomen. These sensors track both the depth and frequency of every breath. During interpretation, we look for specific patterns like suppression, apnea, or “stair-stepping” in the wave patterns. When a person attempts to deceive, their breathing typically becomes more shallow and controlled as the body tries to manage the stress of the “Relevant” question.
Electrodermal Activity (EDA): The Sweat Response
Attached to the fingertips or palms, EDA sensors measure skin resistance and sweat gland activity. This channel is widely considered the most sensitive indicator of a psychological “hit” or reaction. It’s vital to distinguish between “tonic” levels and “phasic” responses. A tonic level represents your steady, resting state of skin conductance. A phasic response is the sudden, sharp peak that occurs within seconds of a stimulus. Because sweat glands are controlled entirely by the sympathetic nervous system, this data is nearly impossible to manipulate through sheer willpower.
Cardiovascular and Motion Sensors
The cardiovascular component uses a standard blood pressure cuff to track heart rate, pulse amplitude, and relative blood pressure. A significant rise in the baseline of the cardio tracing often correlates with the cognitive load of deception. To ensure the integrity of this data, modern systems also include motion sensors, usually located on the seat or under the feet. These sensors detect “countermeasures,” which are physical attempts to trick the equipment by tensing muscles or shifting weight. This meticulous approach to how are polygraph charts read ensures that the physiological data from the other three channels remains pure and untainted by outside interference.
The Numerical Scoring System: How Examiners Quantify Deception
A common misconception is that examiners rely on a “gut feeling” or intuition to determine if someone is lying. In reality, the science of how are polygraph charts read is built on a rigorous, point-based mathematical framework. At Morgan Polygraph, we adhere to the most current American Polygraph Association (APA) standards, ensuring every interpretation is objective and reproducible. By assigning numerical values to physiological changes, we remove personal bias from the equation and focus entirely on the data recorded during the session.
The 3-Position and 7-Position Scales
Modern examiners primarily use the 7-position scale to evaluate charts. This system allows us to compare the intensity of a reaction between two different types of questions. We assign a score ranging from -3 to +3 for each recorded channel. A negative score, such as -2 or -3, indicates a stronger physiological reaction to a “Relevant” question, which suggests potential deception. Conversely, positive scores like +1 or +2 indicate a stronger reaction to a “Comparison” question, suggesting the examinee is being truthful about the core issue. For a deeper look into the scientific scrutiny of these methods, the National Academies report on polygraphs provides an essential critique of accuracy and validity.
According to the APA Standards of Practice updated in August 2024, these scores must meet specific statistical thresholds to reach a final conclusion. If the total score doesn’t reach a high enough positive or negative number, the result is classified as “Inconclusive.” This safety net prevents examiners from making a definitive call when the data is ambiguous, protecting the integrity of the process.
Relevant vs. Comparison Questions
The entire scoring process is essentially a “competition” between different question types. We use “Comparison” questions to establish how your body reacts when you are concerned about your general character or past mistakes. We then compare that reaction to your response during “Relevant” questions, which focus on the specific matter at hand. You can find more detail on this in our guide to Common Lie Detector Questions. A truthful person typically feels more “threatened” by the comparison questions, while a deceptive person’s Autonomic Nervous System will prioritize the relevant questions. This predictable pattern is the foundation of how are polygraph charts read accurately.
Once all charts are completed, the examiner tallies the scores to reach one of three conclusions:
- No Deception Indicated (NDI): The total score is significantly positive.
- Deception Indicated (DI): The total score is significantly negative.
- Inconclusive (INC): The scores remain near zero, and no clear determination can be made.
This methodical approach ensures that every client receives a fair and scientifically backed result. If you need a professional evaluation for a legal or personal matter, you can schedule a confidential consultation with our expert team today.
Analyzing Patterns: What Deception Looks Like on Paper
Identifying a deceptive response is not as simple as spotting a single jump on a screen. Professional examiners look for a “cluster” of physiological shifts that occur across multiple channels at once. If the respiration line flattens while the sweat response peaks, it carries significantly more weight than a solitary spike. This multi-channel alignment is a cornerstone of how are polygraph charts read with accuracy. According to the statistical analysis of polygraph data from Carnegie Mellon University, these patterns provide a mathematical basis for distinguishing between random noise and intentional deception.
Timing is everything in this process. A reaction is only considered valid if it occurs within a specific window, usually within one to five seconds of the question being asked. We also look for consistency. If an examinee reacts strongly to a question in the first chart but shows no response in the second or third, that initial “hit” may just be a random twitch or a stray thought. Finally, we monitor baseline recovery. A truthful person’s body typically returns to its resting state quickly after a stressful question. A deceptive person often exhibits a delayed recovery as their Autonomic Nervous System struggles to reset while they prepare for the next query.
Suppression and Compensation in Breathing
Breathing patterns offer some of the most reliable data during an exam. When people lie, they often unconsciously “hold their breath” or take very shallow sips of air. This is known as respiratory suppression. It’s a classic survival instinct designed to keep the body still and quiet. However, the body can’t sustain this forever. After the question passes, we often see a “rebound” effect where the examinee takes several deep breaths to compensate for the oxygen loss. Because these cycles are governed by the brain’s survival centers, they’re nearly impossible to consciously manipulate without being detected by the sensitive pneumograph tubes.
GSR Peaks and Cardiograph Shifts
The Electrodermal Activity (EDA) or GSR channel creates a very specific “mountain peak” shape when a psychological hit occurs. These peaks are sharp and distinct, standing out clearly from the “tonic” or resting levels of skin conductance. Simultaneously, we watch the cardiograph for a rising baseline. This isn’t just a faster heart rate. It’s a shift in relative blood pressure and pulse amplitude that indicates increasing internal pressure. We even examine the “dicrotic notch” in the heart rate wave. This tiny dip represents the closing of the aortic valve. Under high stress, the position of this notch on the wave can shift or flatten, providing the examiner with a subtle but powerful indicator of physiological strain and blood pressure changes.
The Evolution of Chart Reading: Computer-Assisted Scoring and AI
The field of truth verification has moved far beyond the ink-and-paper era. Today, the process of how are polygraph charts read involves a sophisticated partnership between human expertise and machine intelligence. At Morgan Polygraph, we leverage cutting-edge AI-powered deception detection tools to ensure our findings are rooted in objective data. These systems don’t replace the examiner. Instead, they act as a secondary, unbiased validator. By comparing an examinee’s physiological signals against thousands of verified data sets, AI helps eliminate the risk of human error or subjective bias.
Modern algorithms analyze the complex relationship between your heart rate, breathing, and skin conductance with mathematical precision. This data-driven approach ensures that the final score isn’t just a professional opinion, but a statistically sound conclusion. By utilizing these innovative tools, we provide our Idaho clients with a level of confidence and discretion that traditional methods alone cannot match.
Manual vs. Computerized Analysis
While a certified examiner remains the primary interpreter of the data, computer-assisted scoring (CAS) provides an essential layer of mathematical rigor. We utilize the Empirical Scoring System (ESS), which is the current gold standard for digital polygraphy. This system assigns values based on validated physiological markers, ensuring that every “point” awarded is backed by statistical probability. This combination of human oversight and digital precision is a major reason why modern testing is so reliable. You can explore more about these benchmarks in our detailed analysis: Are Polygraphs Accurate?
The computer doesn’t just look at the lines; it calculates the area under the curve and the frequency of shifts with a level of detail the human eye simply can’t match. This is especially true for electrodermal activity (EDA), where the APA adopted new recording and display standards in August 2023 to ensure maximum data clarity. These digital tools act as a “mathematical second opinion” that reinforces the examiner’s findings.
AI and Behavioral Speech Analysis
The next frontier in professional testing involves integrating behavioral speech analysis and facial microexpression recognition. AI algorithms are now capable of detecting micro-patterns in data that suggest cognitive load or emotional distress. For instance, computerized scoring algorithms like OSS-3 have demonstrated a 91.5% accuracy rate in controlled studies, often outperforming human scorers by providing a purely objective analysis. By combining traditional physiological charts with these modern behavioral tools, truth verification in 2026 has reached a level of reliability that was once considered impossible.
We believe in providing the most accurate results possible through constant innovation and the integration of forward-thinking technology. If you want the confidence that comes with AI-verified truth detection, contact Morgan Polygraph for an expert consultation.
Why Expert Interpretation in Idaho Matters for Legal and Private Cases
Technical data is only one piece of the puzzle. While digital algorithms provide a mathematical foundation, the final determination depends on the examiner’s ability to distinguish between physiological stress and intentional deception. Understanding how are polygraph charts read in a high-stakes environment requires a deep knowledge of human behavior. An inexperienced examiner might mistake the tremors of a nervous, innocent person for the calculated responses of a deceptive one. At Morgan Polygraph, we prioritize a compassionate and respectful environment because we know that a calm examinee produces the cleanest, most readable charts.
The “human element” remains the most critical component of truth verification. Professional examiners look for specific patterns that align with the brain’s survival instincts rather than just a racing heart. In Idaho, where the Daubert standard governs the reliability of scientific evidence, having a court-recognized expert interpret your results is essential. This expertise ensures that the charts meet the rigorous standards of the American Polygraph Association, which as of May 2026, continue to demand at least 90% accuracy for evidentiary testing.
Certified and Court-Recognized Examiners
Experience is the ultimate validator in this field. With over 40 years of combined polygraph testing experience, Chip Morgan provides a level of insight that software alone cannot replicate. This depth of knowledge is particularly important for criminal defense and civil cases in Boise. We understand the local legal landscape and the specific requirements for stipulated admissibility in Idaho courts. If you are searching for a trusted professional, our guide on finding a Polygraph Near Me offers essential tips on verifying credentials and experience levels.
Scheduling Your Examination in Boise
Accuracy begins long before the first question is asked. When you visit our Boise office at 6126 W. State Street, we take the time to prepare you for the process. This pre-test phase is vital for establishing an accurate baseline and ensuring that you understand every question. We don’t just attach sensors; we build the necessary rapport to ensure the physiological data is pure and untainted by outside confusion. This methodical preparation is a core reason why our interpretation of how are polygraph charts read remains the gold standard in Idaho.
We handle every case with the highest level of discretion and professional integrity. Whether you are dealing with a sensitive relationship issue or a complex legal matter, you deserve results you can trust. Call Chip Morgan today to schedule your confidential truth verification.
Secure Your Peace of Mind with Professional Truth Verification
Understanding the intricate details of how are polygraph charts read provides the clarity you need to face a test with confidence. We’ve explored how the Autonomic Nervous System generates raw data, how numerical scoring removes subjectivity, and how 2026-era AI technology validates every result. This methodical approach ensures that your reputation is protected by rigorous science rather than left to chance or simple intuition.
At Morgan Polygraph, we combine over 40 years of combined experience with state-of-the-art AI-powered technology to deliver the most accurate results in Idaho. As nationally certified and court-recognized experts, we understand the stress of these situations and prioritize a compassionate, discreet environment. Whether you’re navigating a complex legal challenge or a sensitive personal matter, you deserve a process that’s both professional and precise.
Schedule a Confidential Polygraph with Boise’s Leading Expert and take the first step toward the truth today. We’re here to provide the expert guidance and definitive answers you need to move forward with peace of mind.
Frequently Asked Questions
What does NDI stand for in a polygraph report?
NDI stands for No Deception Indicated. This result occurs when the numerical scores from the physiological data meet or exceed the positive threshold required by the American Polygraph Association (APA). It signifies that the examiner found no significant or sustained physiological reactions to the relevant questions asked during the examination.
Can being naturally nervous make the polygraph charts look like I’m lying?
General nervousness does not look like deception because examiners establish a clear physiological baseline before the actual testing begins. While you may be anxious throughout the process, deception is identified by a specific, phasic reaction that occurs only when a “Relevant” question is asked. This distinction is a fundamental part of how are polygraph charts read accurately by certified professionals.
What happens if the polygraph chart is inconclusive?
An inconclusive result, or INC, means the physiological data did not produce a score high enough or low enough to reach a definitive conclusion. According to the 2011 APA meta-analysis, the average inconclusive rate for validated techniques is approximately 13%. In these cases, the examiner may schedule a re-test at a later date to gather clearer data.
How long does an examiner spend reading the charts after the test?
A professional examiner typically spends 30 to 60 minutes conducting a detailed manual analysis of the charts after the session ends. While modern computerized algorithms provide instant scoring, the human examiner must still manually verify every data channel for quality and artifacts. This ensures the final report meets the 90% accuracy standard required for evidentiary examinations.
Are digital polygraph charts more accurate than old-fashioned paper ones?
Digital polygraph charts provide higher accuracy because they offer superior resolution and the ability to use computer-assisted scoring. In August 2023, the APA adopted new requirements for recording and displaying electrodermal activity (EDA) that only digital systems can meet. These modern systems allow examiners to zoom in on micro-patterns that were often invisible on traditional moving paper.
Can an examiner tell if I’m using countermeasures on the chart?
Yes, examiners identify countermeasures through specialized motion sensors and specific anomalies in the respiration and cardiovascular channels. Physical attempts to manipulate the test, such as muscle tensing or controlled breathing, create distinct “artifacts” on the chart. Professional examiners are trained to recognize these artificial patterns as a deliberate effort to interfere with the truth verification process.
Do polygraph charts show the specific lie I told?
Polygraph charts do not show the specific words of a lie; they record your body’s involuntary reaction to a specific question. The data reflects the Autonomic Nervous System’s “fight-or-flight” response. If you react significantly to a question about a specific event, the examiner interprets that reaction as an indicator of deception regarding that specific topic.
Is there a specific “lie” line on the chart?
There is no single “lie line” on a polygraph chart. The determination of truth or deception is based on the combined analysis of four primary data channels: respiration, electrodermal activity, and cardiovascular changes. Understanding how are polygraph charts read involves looking for a cluster of reactions across all these lines simultaneously rather than relying on one specific indicator.